
(Updated October 31, 2025)
Perhaps the most confusing aspect of a chi-square table is how to report on percentages of respondents. The important thing to remember is that, in a statement of the form "the percentage of people in group A have characteristic B," the order of A and B is not interchangeable.
Here's an example. I would estimate that about 80% of the players in the National Basketball Association (NBA) are from the U.S. (players such as the Dallas Mavericks' Dirk Nowitzki and the Houston Rockets' Yao Ming are part of the growing international presence). However, we would never claim the reverse -- that 80% of the people in the U.S. are NBA basketball players! Using a more complex example, Jessica Utts (2003, "What educated citizens should know about statistics and probability," The American Statistician) refers to this type of error as "Confusion of the Inverse."
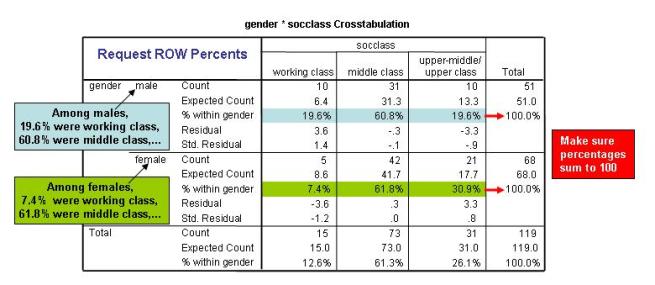
We thus have to be careful about phrasing the results of a chi-square analysis. A good practice is to request only ROW percentages from SPSS for the cells in the table. If you follow this practice, then you can always phrase your results in the following form. For any given cell, you can say something like:
"Among [category represented by the row], ___% [shown in cell] were [characteristic represented by the column]."
This format corresponds to the SPSS output in the following manner:
Update, November 13, 2007: Television host Keith Olbermann of MSNBC's "Countdown" awarded himself third place in his nightly "Worst Person in the World" competition. Olbermann's offense? He committed a statistical reversal error of the type described above. Quoting from the transcript of the show:
The bronze to me. We inverted a statistic last night. The study based on stats from the Veterans Affairs and Census Bureau indicating the heart breaking percentage of homeless veterans. I said one in every four veterans is homeless. In fact, one of every four homeless is a veteran. That makes the number smaller. It is, quote, only, unquote, 194,000; 1,500 of them, according to the V.A., veterans of Afghanistan and Iraq, already on the streets. I apologize for the statistical mistake.
Here are some other tips:
1. The statistical significance of a chi-square analysis pertains to the table as a whole. You're saying that the overall chi-square (which is the sum of the cell-specific chi-squares) exceeds the critical value for a given degrees of freedom and significance level.
2. To see if one or more cells are making particularly large contributions to the overall significance of the chi-square, you can have SPSS provide the unstandardized (regular) and standardized residuals for each cell. The regular residual is just the difference between the observed and expected frequency counts for a given cell. The standardized residual puts the residual in z-score form, so that any standardized residual that's 1.96 or greater (in absolute value) could be said to be a major contributor to the overall chi-square. (Positive residuals indicate that, for a given cell, the observed count was higher than the expected one, whereas negative residuals convey that fewer people were observed in the cell than expected.) With large sample sizes, many cells may have standardized residuals greater than 1.96, making it a little harder to pinpoint any one or two cells where the "action" is. In general, though, I find standardized residuals very helpful.
3. SPSS also provides adjusted standardized residuals. In this video by John Hayes around the 8:00 point (with POAG referring to whether an eye patient has Primary Open-Angle Glaucome), he explains that you should use adjusted standardized residuals when (a) the sample is large, and (b) frequencies are unbalanced (e.g., many more people do not have POAG than have it).
4. If your overall chi-square for an analysis is significant, you should describe your findings in a way that emphasizes contrast. For example: "Among women, 39% followed the election campaigns closely, whereas only 28% of men did."