Our next statistical technique is the t-test, for comparing two means and seeing if the difference is significant. Most of what we need is on my "Basic Statistics" lecture page for my research methods class (see links section on the right).
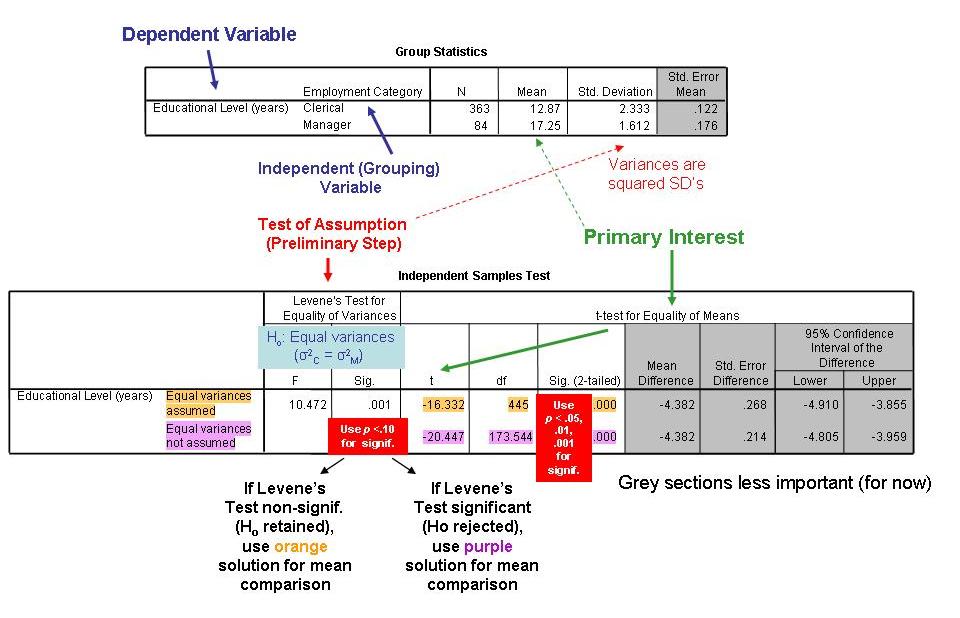
Previous years' experience suggests, however, that the SPSS printout for the independent-samples t-test is confusing to some students, so I have created a pictorial explanation (below). You can click on the picture to enlarge it and then, when it opens, an enlarger icon should appear to make it even bigger.